
I am happy to announce the first release of the R-package RWebData on Bitbucket. The main aim of the package is to provide high-level functions that facilitate the access and systematic collection of data from REST APIs for the purpose of statistical analysis. RWebData is thus made for users that predominantly use R as a statistical software but do not have experience with web APIs and/or web data formats. In a broader sense (and in the long run) the package should serve as a high level interface to the programmable web for research in the social sciences (i.e., accessing the programmable web as a data source). The package thus takes up some of the broader ideas discussed in our paper on the pvsR-package. A short paper with a broader motivation for the package, some discussion of the package's architecture, as well as a practical introduction with several examples can be found here.
RWebData builds on many important packages that facilitate client-server interaction via R/HTTP as well as different parsers for web-data formats (including: RCurl, jsonlite, XML, XML2R, httr, mime, yaml, RJSONIO). At its core, the package provides a generic approach to map nested web data to a flat data representation in the form of one or several (non-nested) data-frames.
Created by Pretty R at inside-R.org
More examples will follow...
RWebData builds on many important packages that facilitate client-server interaction via R/HTTP as well as different parsers for web-data formats (including: RCurl, jsonlite, XML, XML2R, httr, mime, yaml, RJSONIO). At its core, the package provides a generic approach to map nested web data to a flat data representation in the form of one or several (non-nested) data-frames.
A simple example
This example is taken from the working paper on arXiv. It illustrates the very basic usage of the package: Say you want to statistically analyze/visualize data provided from a web API, all you have is an URL pointing to the data of interest, you do not know/care what JSON, XML and the like are, you simply want the data in a format that is suitable for statistical analysis in R.
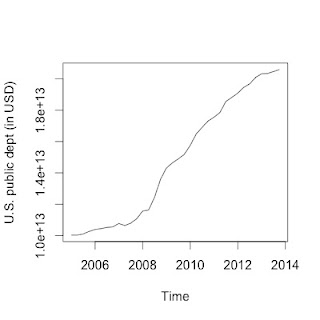
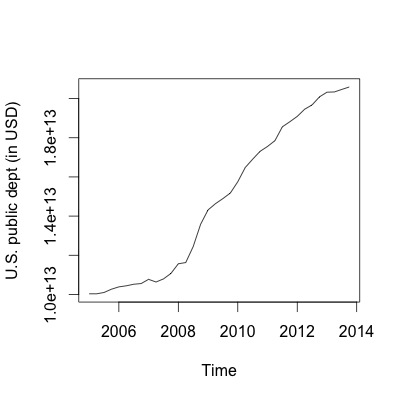
Here, we want to fetch data from the World Bank Indicators API which provides time series data on financial indicators of different countries (as XML in a compressed text file). In the example, we query data from that API in order to investigate how the United States' public dept was affected by the financial crisis in 2008.
# install the package directly from bitbucket
library(devtools)
install_bitbucket('ulrich-matter/RWebData')
library(RWebData)

# fetch the data and map it to a table-like representation (a data-frame)
u <- "http://api.worldbank.org/countries/USA/indicators/DP.DOD.DECN.CR.GG.CD?&date=2005Q1:2013Q4"
usdept <- getTabularData(u)

# analyze/visualize the data
require(zoo)
plot(as.ts(zoo(usdept$value,  as.yearqtr(usdept$date))),
     ylab="U.S. public dept (in USD)")
More examples will follow...
It's so true! Amazing sir! I agree with all your concepts of the classical customer experience enhancing strategies that are completely moved to digital form. I also can visualise the good scope of a ux developer assisting businesses to accomplish their targets. However, I am also a professional UX developer, and I have experienced this. Still, freelancing platforms are concerned where the reliability is less. Is there something to suggest?
ReplyDelete